Kenya's NHIF collected KES 40B and paid out KES 38B — here's what nine years of data says about the fund's health
NHIF loss ratios, surplus swings, and what the 2019 near-insolvency and COVID dip reveal about structural fragility — just as NHIF gives way to SHIF.
The National Hospital Insurance Fund (NHIF) has been under significant stress. It pays out almost everything it collects. There are several reasons why this might be the case, but one major culprit is corruption within health facilities. There is a strong profit incentive for health providers to inflate the price of their services, recommend more expensive treatments, and sometimes collude with patients to defraud the insurer. As Kenya transitions to the Social Health Insurance Fund, questions abound on how prepared the new system is to fix the challenges its predecessor faced. I ran an analysis of the insurance data and here are a few interesting findings.
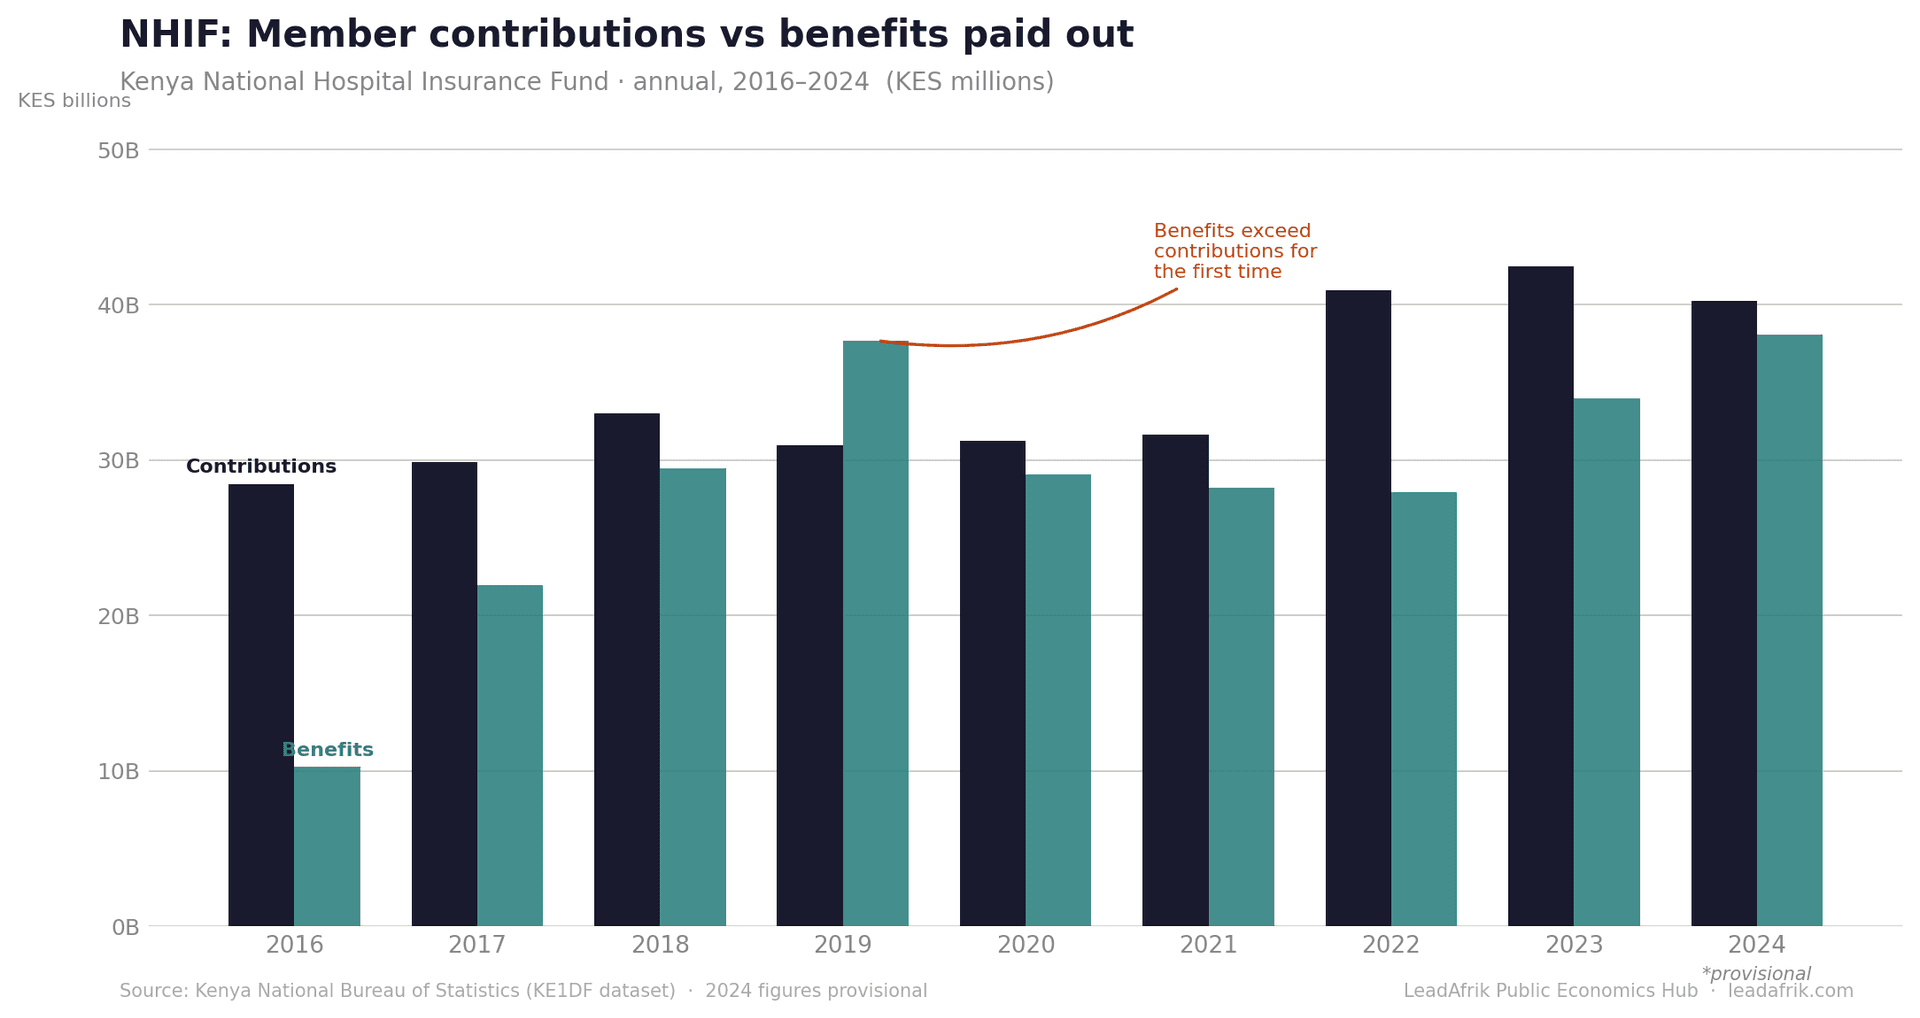
Kenya’s health insurer collected KES 40B in 2024. It paid out KES 38B. That 95% loss ratio shows enormous pressure on the system.
2019 was alarming
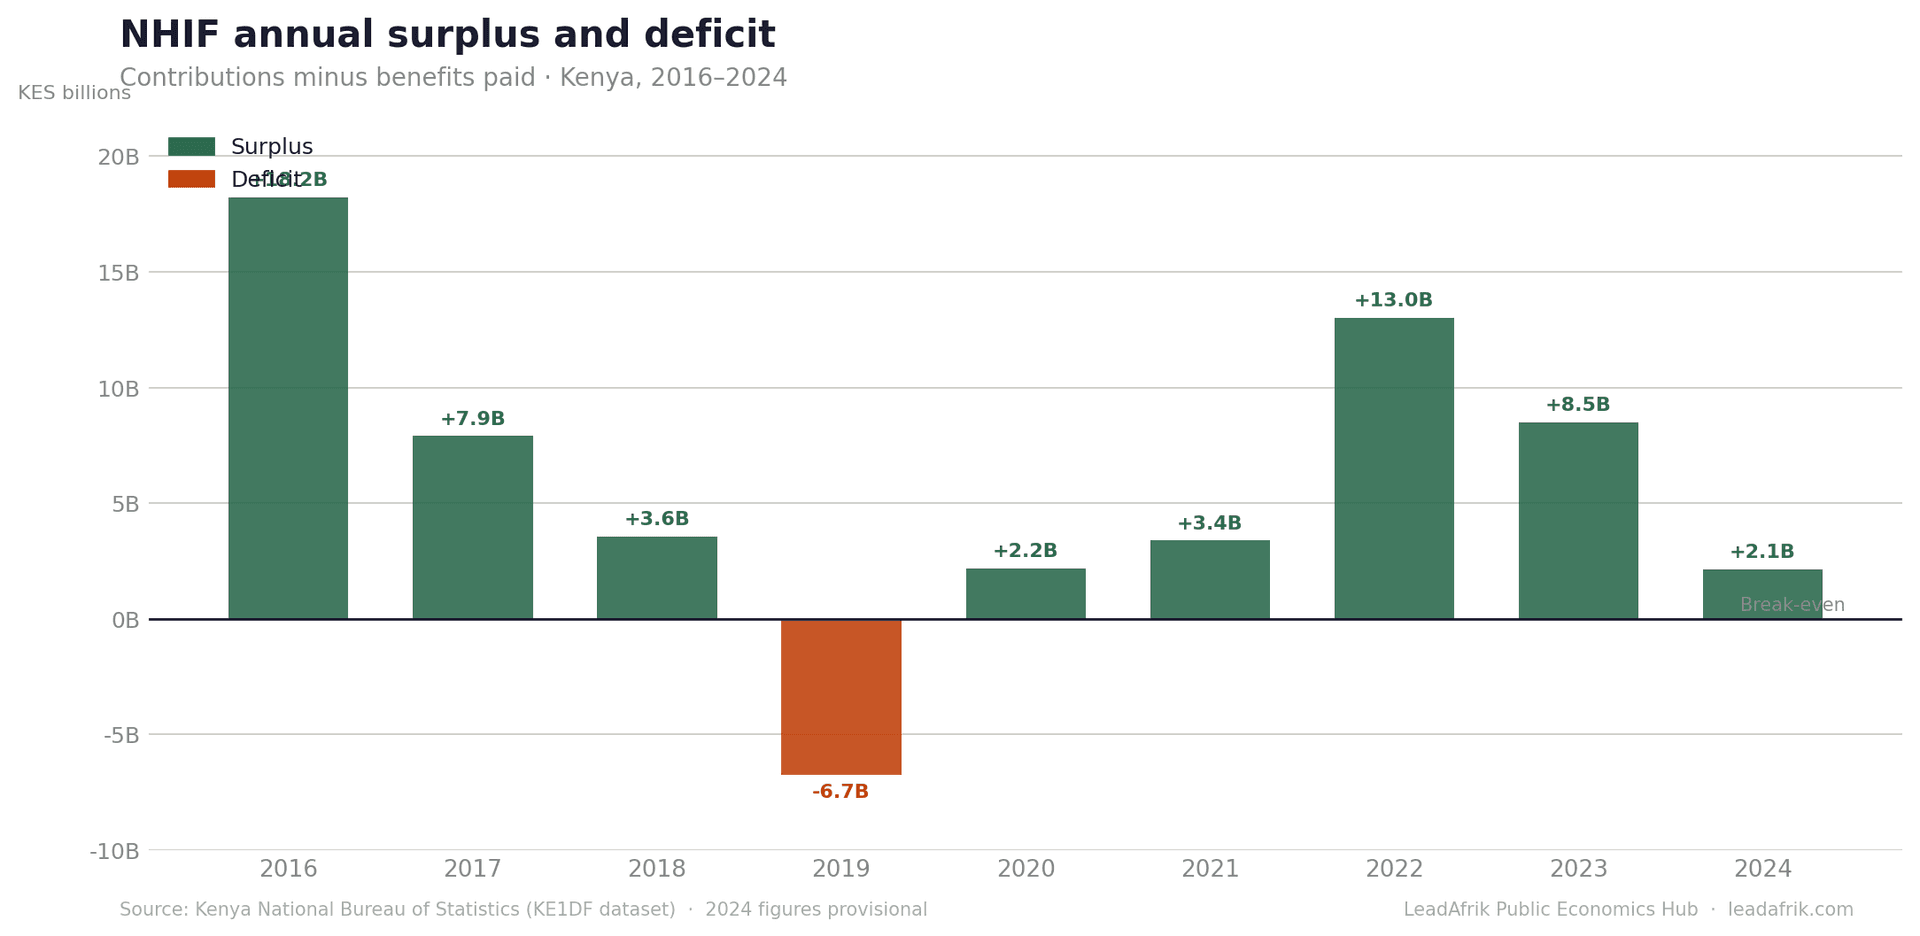
Benefits surged to KES 37.7B against contributions of just KES 31B — a loss ratio of 122%. The fund paid out significantly more than it collected, an unsustainable trajectory for a national health scheme.
COVID-19 surprisingly helped the books
That is an observation worth further investigation. It may be that fewer people visited hospital for mild illnesses, or that people were scared of contracting COVID and avoided facilities altogether. It may also be that travel restrictions and quarantine measures slowed every sector of the economy, including healthcare. Those are initial hypotheses worth digging into.
Either way, in 2020 and 2021 benefits paid actually fell to KES 29B and KES 28B respectively, even as contributions held steady at around KES 31B. Deferred care and facility lockdowns reduced claims, providing temporary breathing room — but nowhere near fixing the structural problem.
The loss ratio tells the structural story
The loss ratio — benefits paid divided by contributions collected — is the clearest single-number summary of a health fund’s financial position. A ratio below 100% means the fund is accumulating reserves; above 100% it is drawing them down.
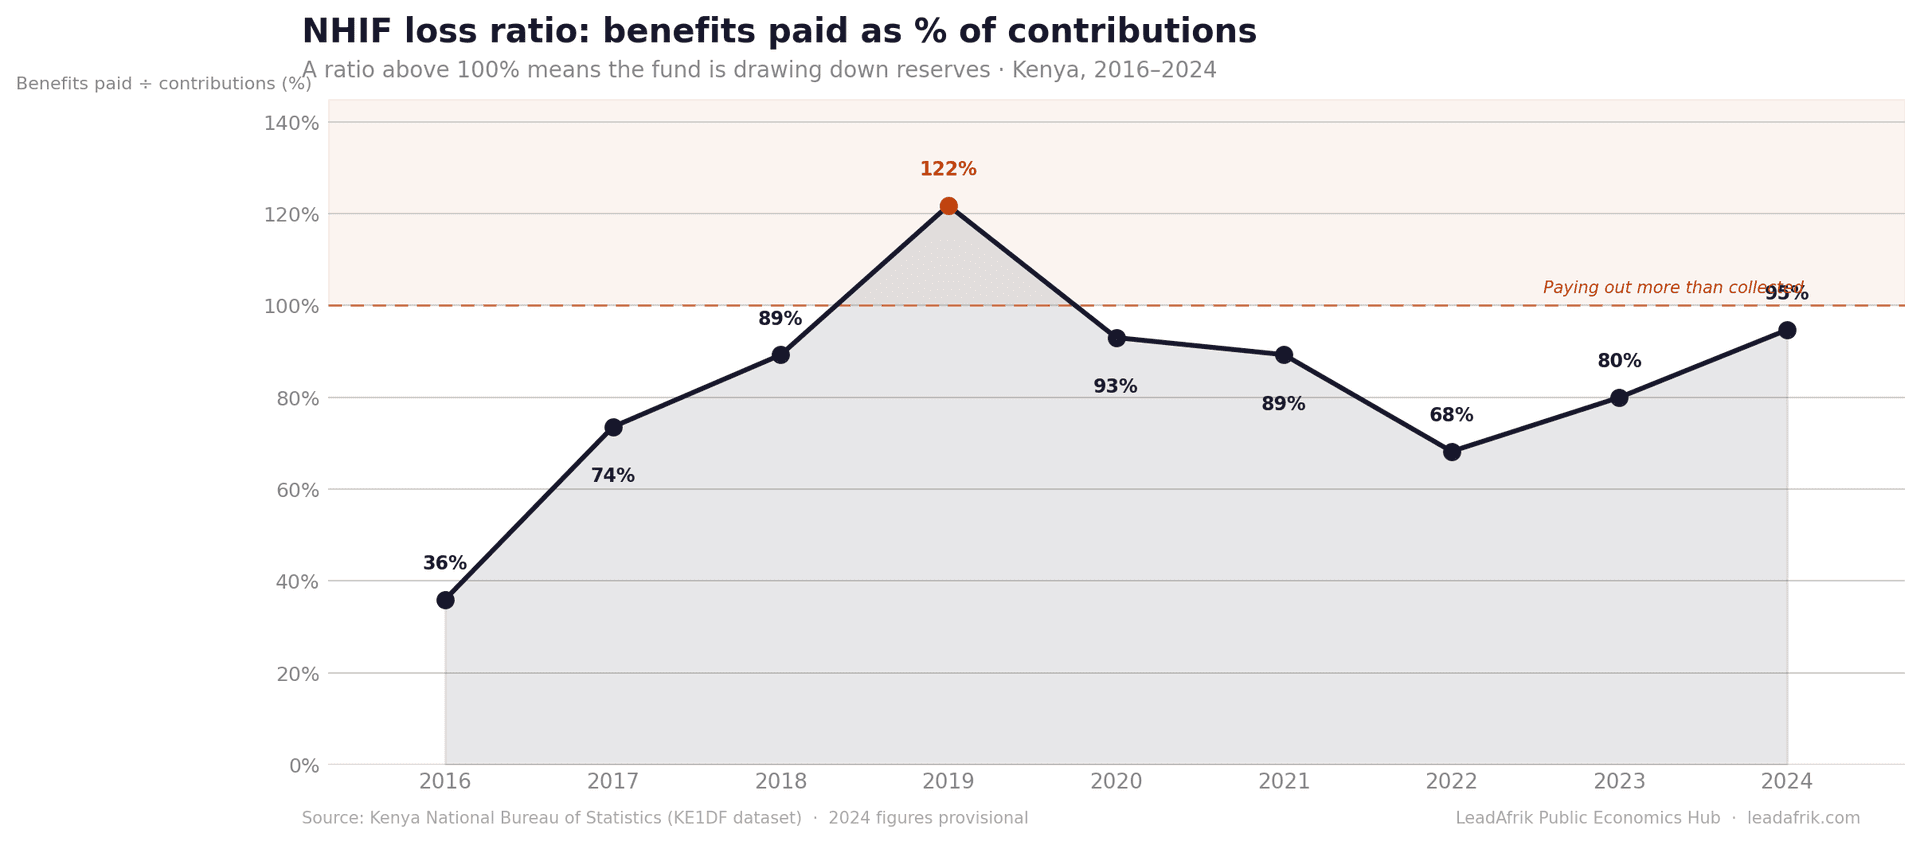
There was a major jump in contributions to KES 41B in 2022, which bought some relief. This likely reflects expanded informal sector outreach and revised contribution rates. But the 2024 provisional data already shows contributions falling back to KES 40.2B while benefits climb toward KES 38.1B. The gap is closing again.
SHIF is now replacing NHIF
Kenya’s Social Health Insurance Fund went live in late 2023. The transition carries all the financial fragility of its predecessor — without the institutional memory. The 2024 numbers will be the last true NHIF baseline.
The big question: can SHIF fix the structural mismatch between what Kenyans pay in and what they claim out — especially as an ageing population and a growing NCD burden push benefits higher? We will be tracking this closely.
For more Kenya public-finance data and analysis, see the Hub or browse the data store.
Share
If this is useful, send it to someone who'll benefit.