Kenya's KES 3 Trillion Wage Economy: Nine Years of Earnings Data, Unpacked
From 2015 to 2024, Kenya's formal wage bill nearly doubled — from KES 1.54 trillion to KES 3.00 trillion. A sector-by-sector breakdown of KNBS earnings data reveals which industries drove that growth, who COVID-19 hit hardest, and where 65% of the government's wage spending actually goes.
The Numbers Behind Kenya's Formal Wage Economy
Every year, Kenya's National Bureau of Statistics publishes what it calls the Employment Earnings dataset — a granular accounting of wages and salaries paid across every sector of the formal economy, split between private and public employers. The 2015–2024 series, sourced from KNBS survey data and denominated in Kenya Shillings millions, lets you trace nine years of labour market history across twenty industries.
The headline: Kenya's combined formal wage bill grew from KES 1.54 trillion in 2015 to KES 3.00 trillion in 2024. Both sectors — private and public — roughly doubled their payrolls over the period. The compound annual growth rate for private sector wages was 7.74%. For the public sector it was 7.45%. Almost identical, which turns out to be the most interesting part of the story.
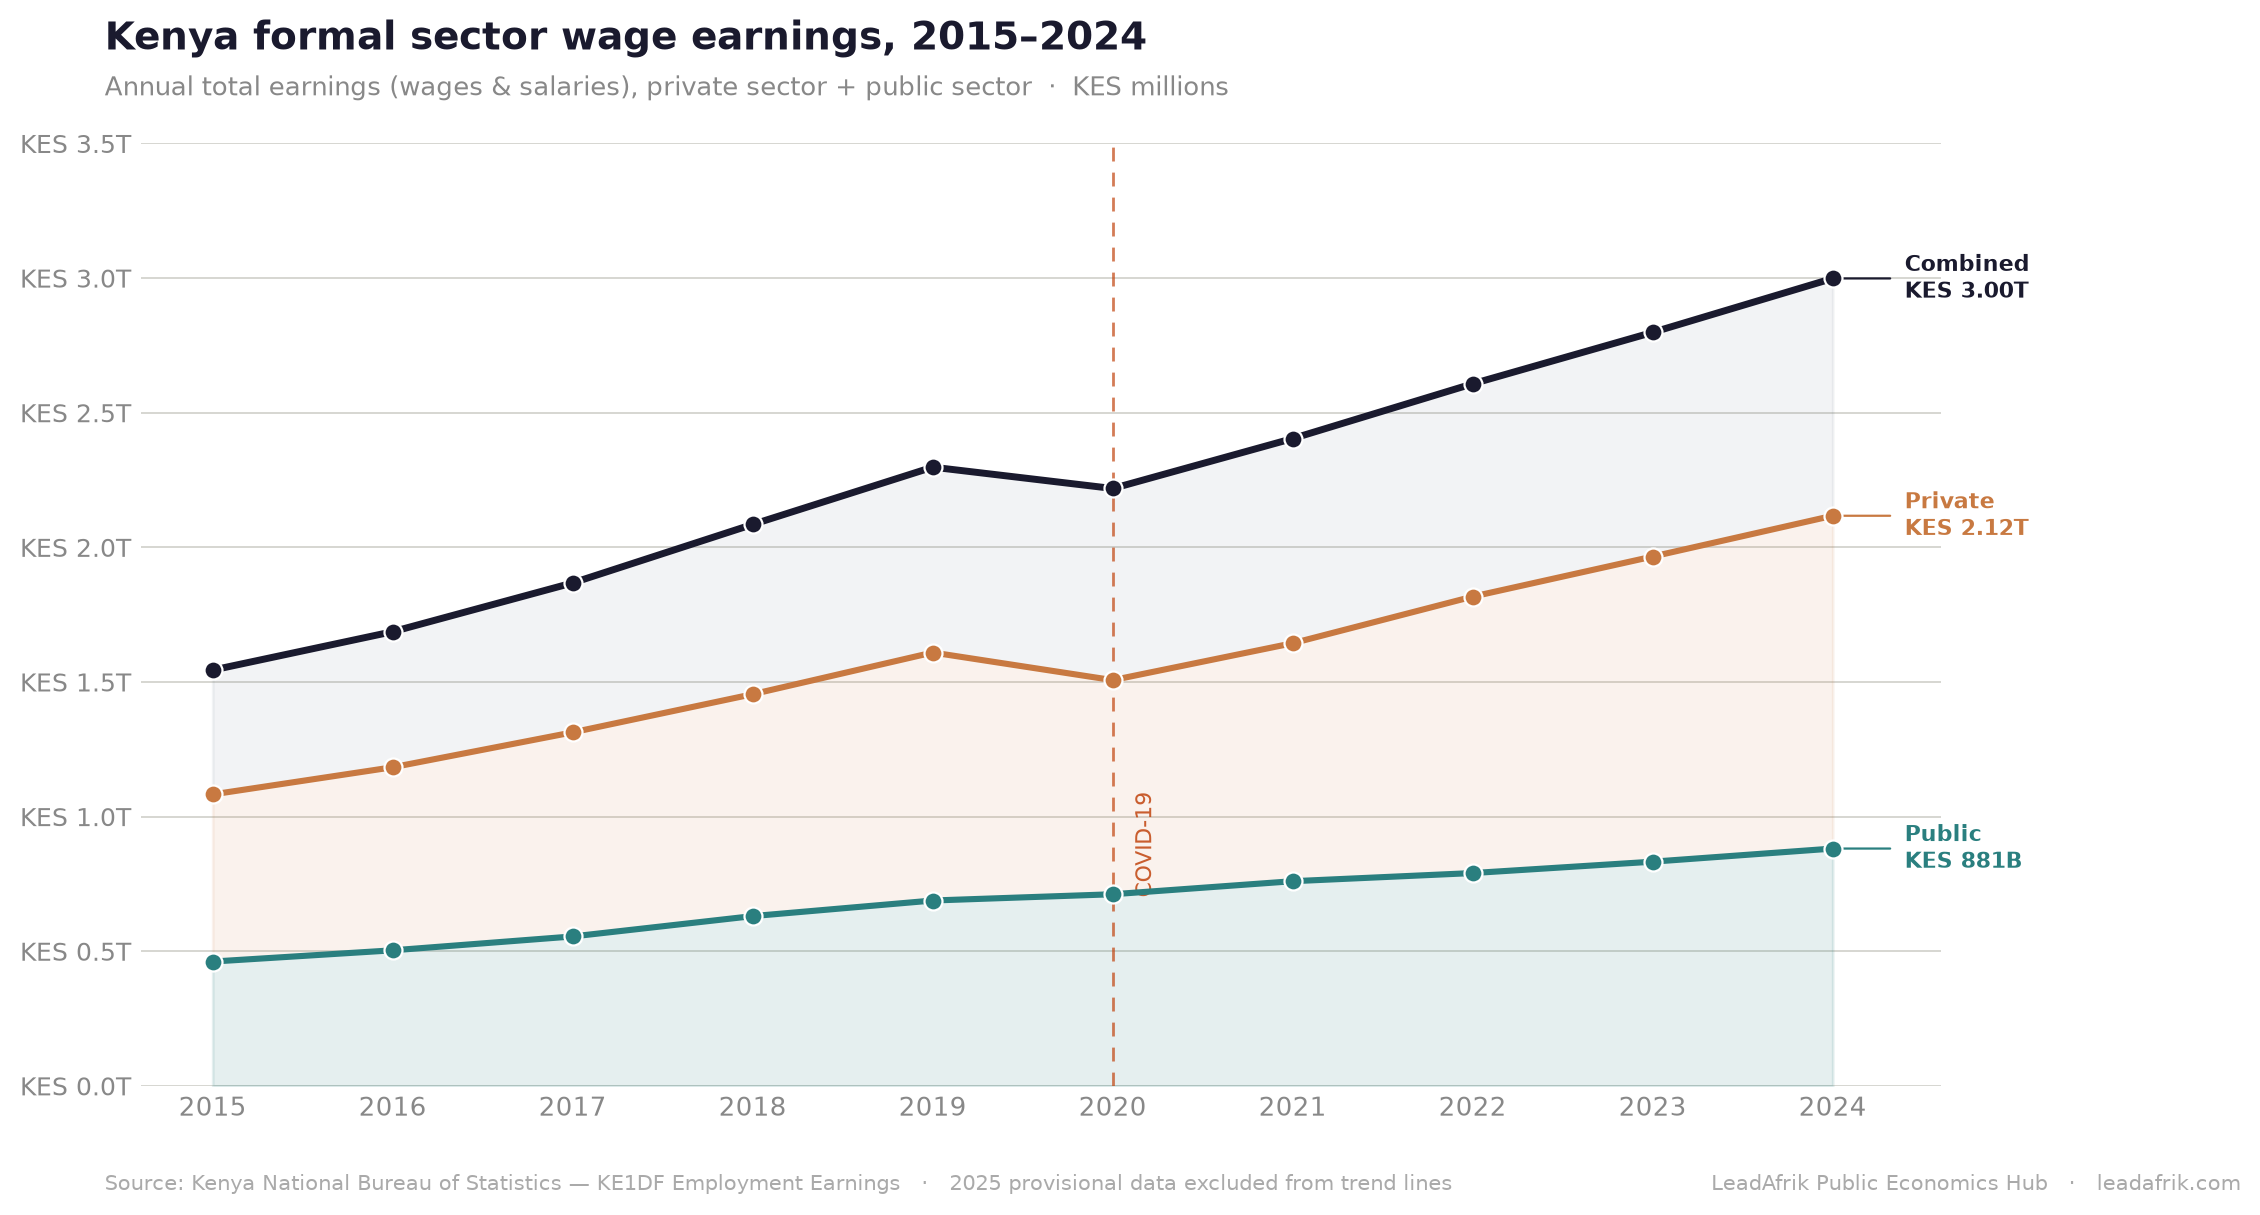
One line dips. The other doesn't. The private sector contracted 6.4% in 2020 — the only year in the entire nine-year series where earnings fell. The public sector grew 3.4% that same year, and has grown every single year from 2015 through 2024 without exception. This is not a coincidence. It reflects the structural insulation that comes with a non-negotiable state payroll, and it shapes how economic shocks move through the Kenyan economy.
Who Earns What: The Private Sector in 2024
By 2024, the private sector was paying out KES 2.12 trillion in wages annually. That money is not spread evenly.
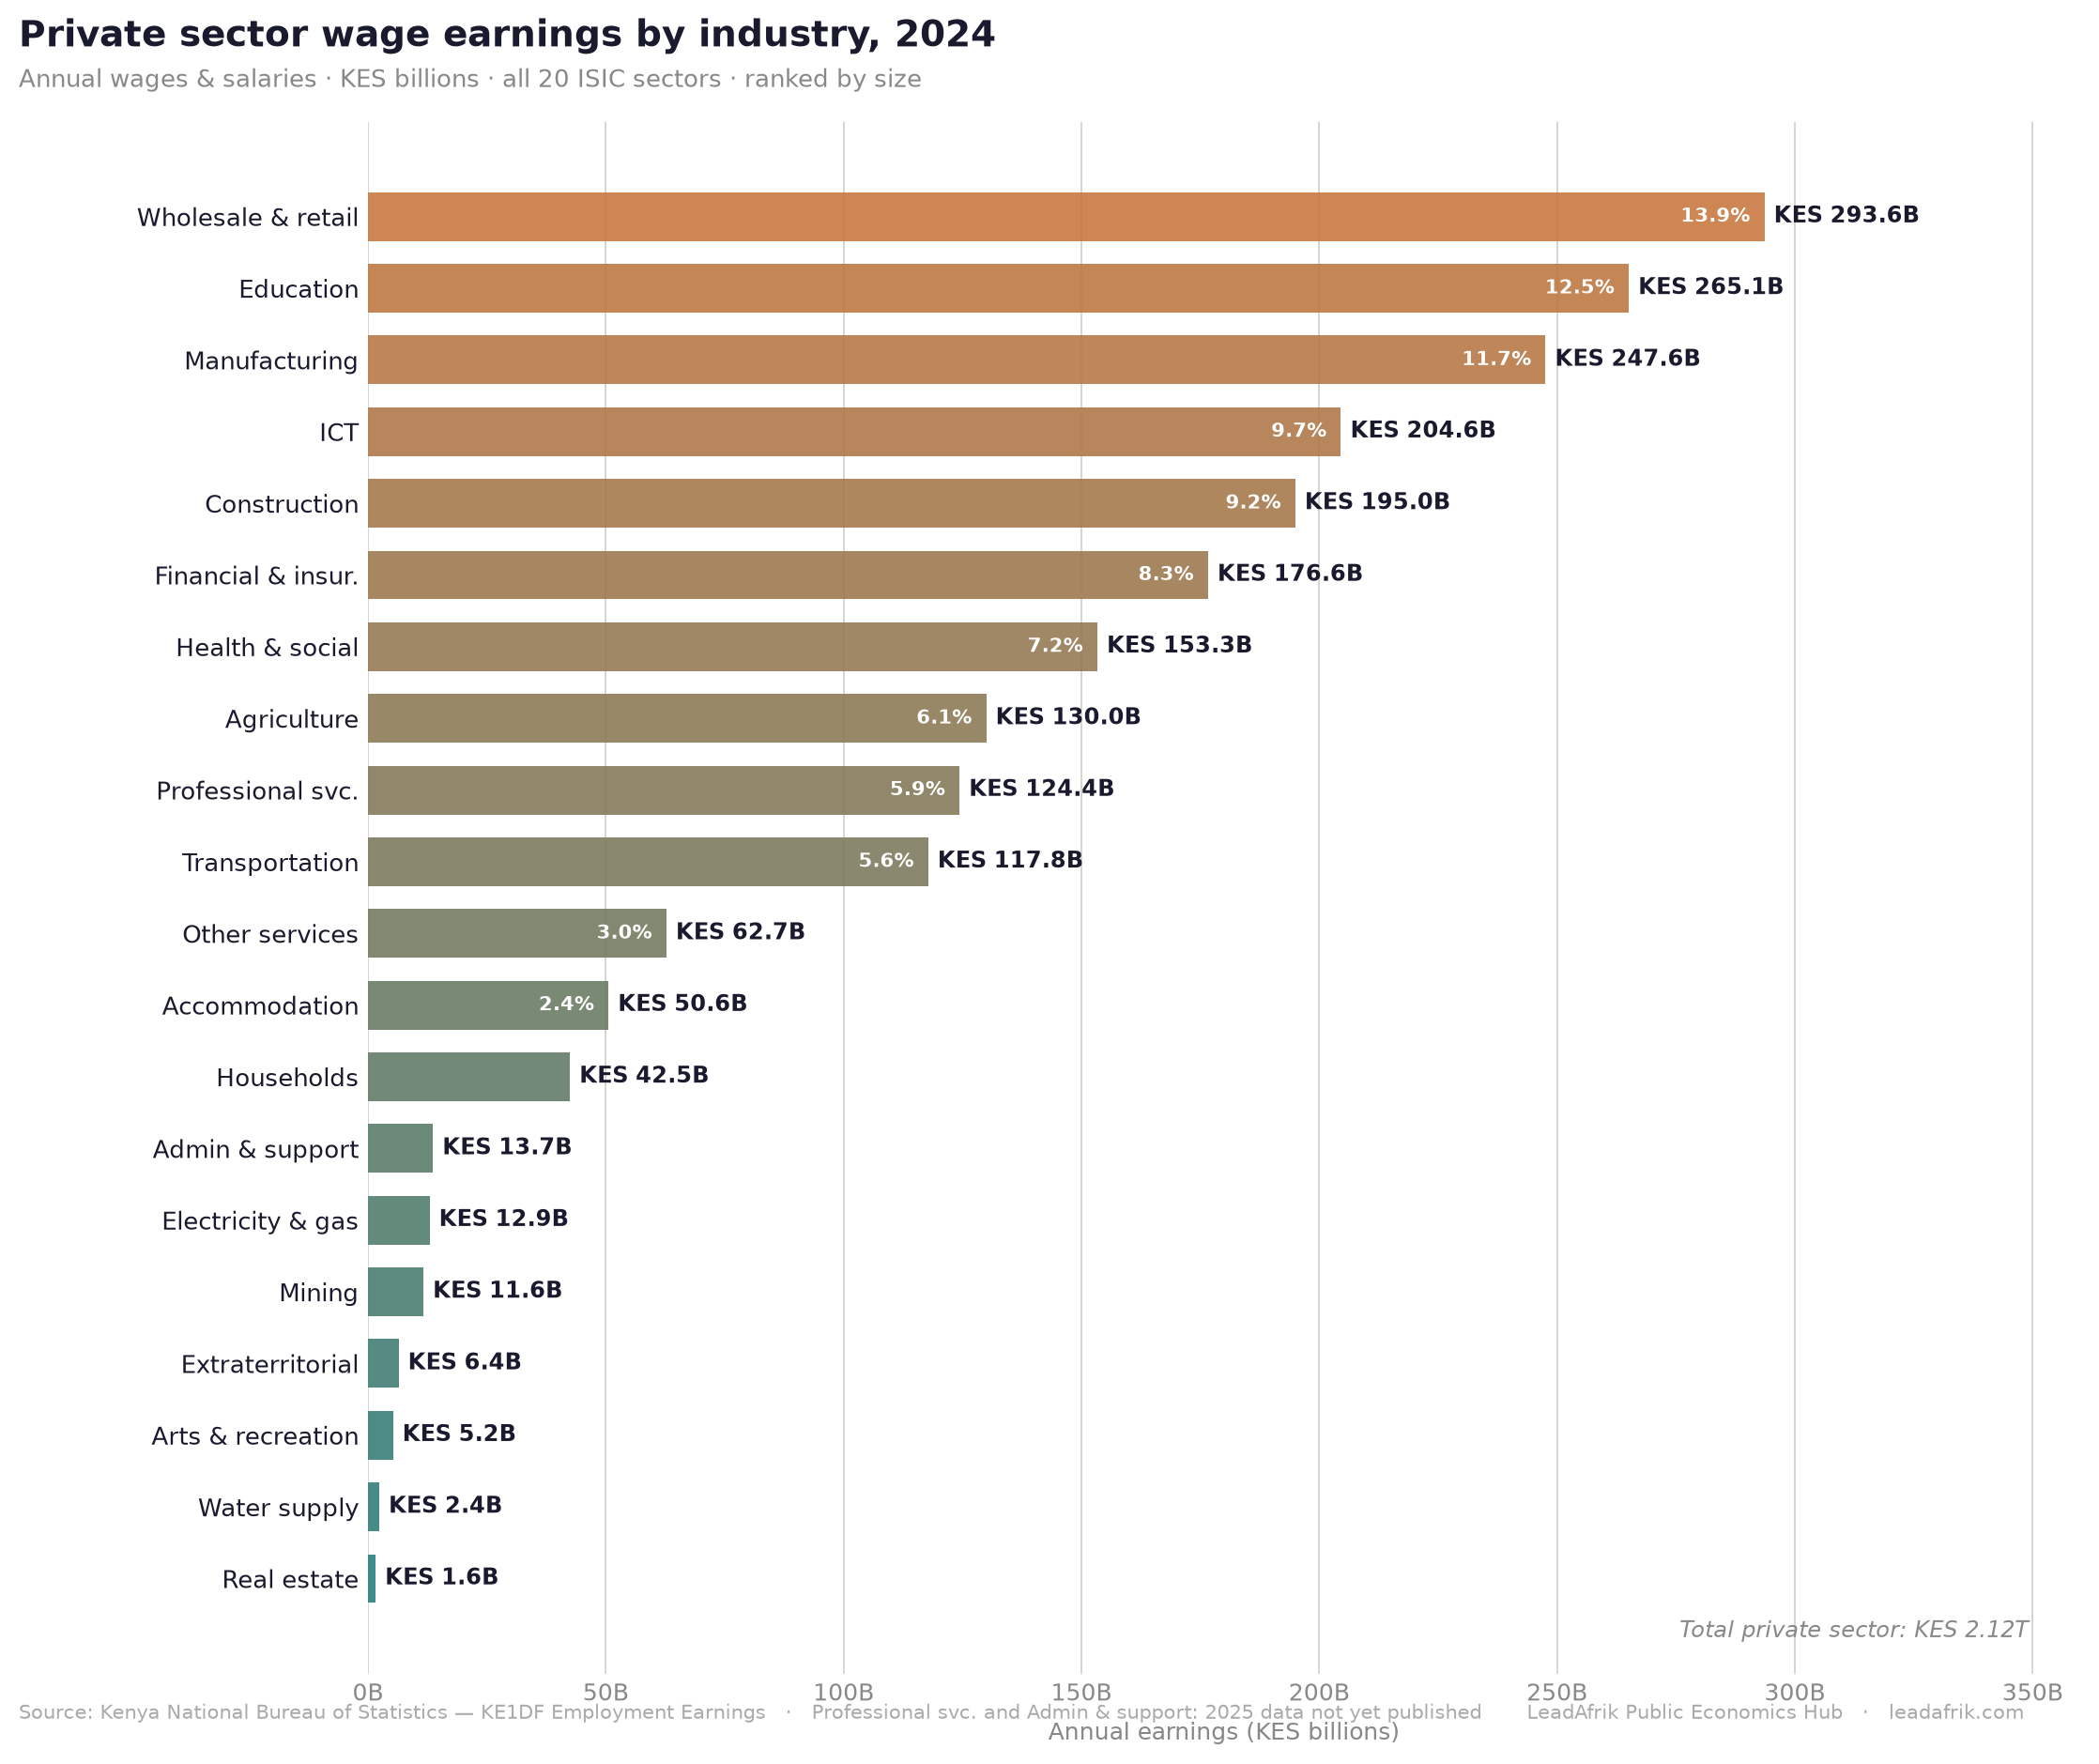
Five industries account for more than half of all private sector wages:
| Industry | 2024 Earnings | Share of Private Total |
|---|---|---|
| Wholesale & retail trade | KES 293.6B | 13.9% |
| Education | KES 265.1B | 12.5% |
| Manufacturing | KES 247.6B | 11.7% |
| ICT | KES 204.6B | 9.7% |
| Construction | KES 195.0B | 9.2% |
Wholesale and retail trade sits at the top, a reflection of Kenya's large informal-to-formal distribution sector employing sales staff, logistics workers, and shop-floor employees across the country. Education in second place is less obvious — it reflects the scale of Kenya's private school system, which employs a significant share of the country's teachers outside the public payroll. Manufacturing in third place tracks Kenya's industrial base: food processing, beverages, textiles, and light industry concentrated around Nairobi and Mombasa.
At the bottom of the ranking sit Real estate (KES 1.6B) and Water supply (KES 2.4B) — capital-intensive sectors that generate economic output without large direct wage bills.
The ICT position deserves attention. At KES 204.6B in 2024, ICT now sits above the entire Financial and insurance sector (KES 176.6B). It has done so since 2018. The digital economy has been the larger employer of the two in wage terms for six years, yet it rarely features in policy conversations about where Kenya's employment growth is coming from.
The COVID Chapter: Which Industries Broke, Which Held
2020 was the only year in this dataset when private sector wages fell. The breakdown by industry is more revealing than the aggregate.
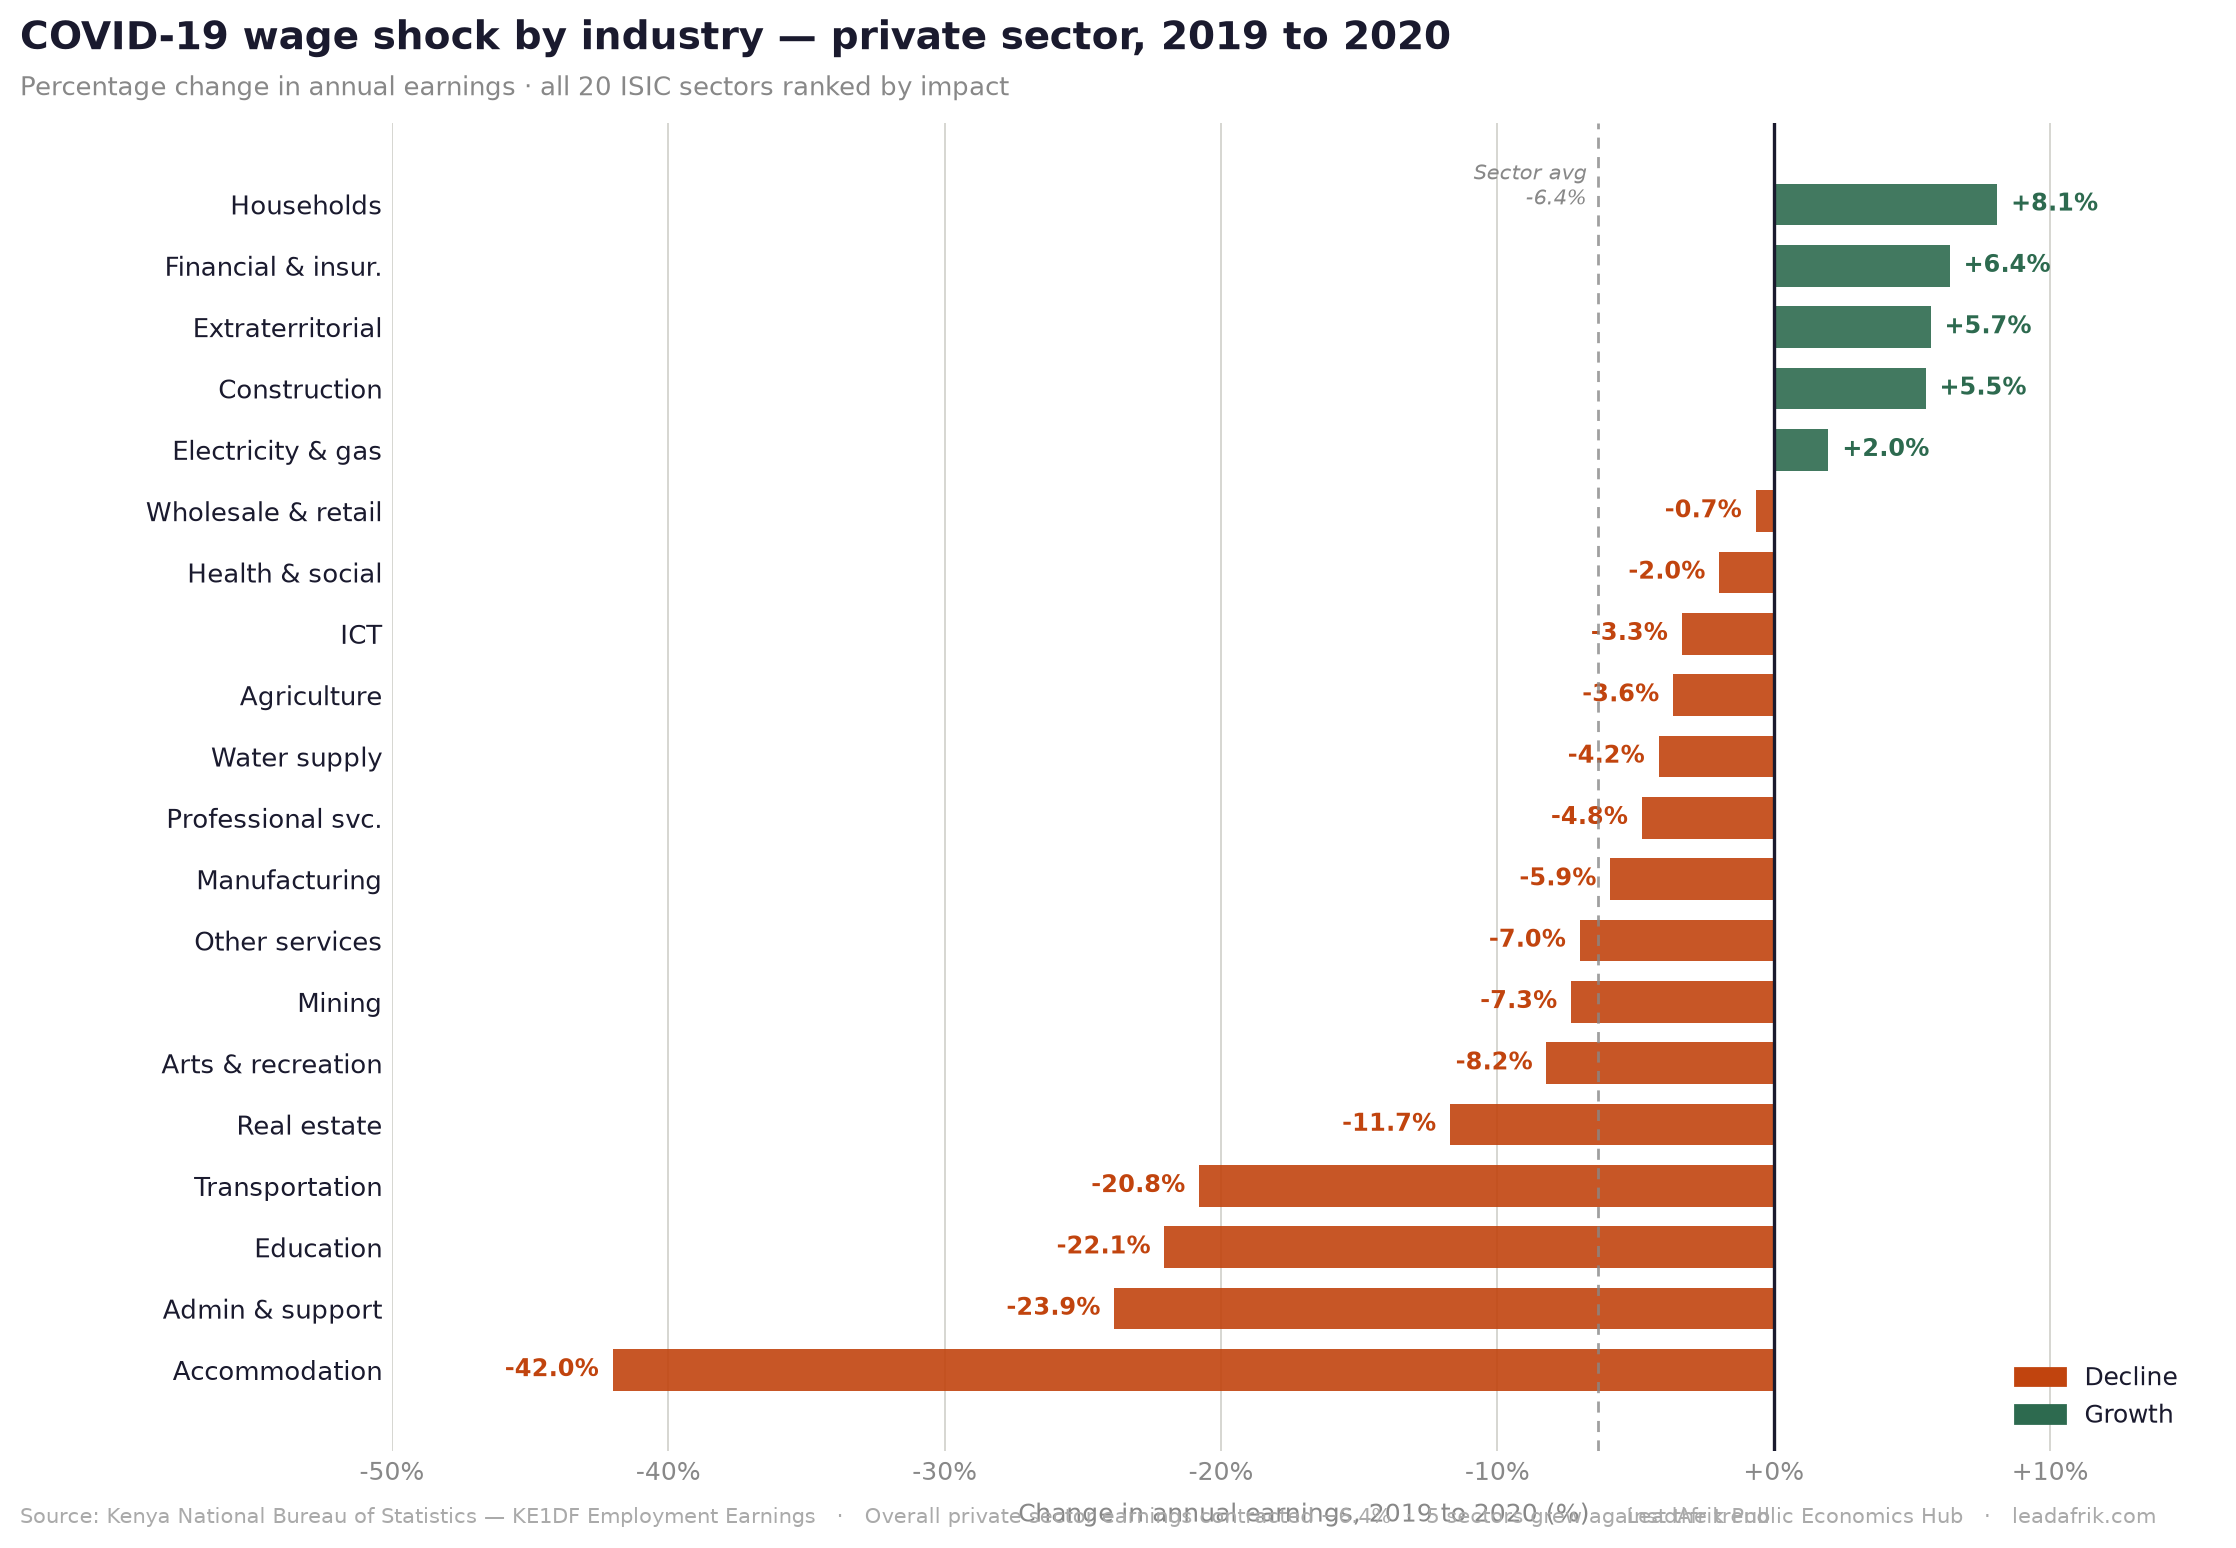
Accommodation and food services fell 42% — from KES 36.9B to KES 21.4B. That number gets cited. What gets less attention is that private education fell 22% in the same year, dropping by KES 50.3 billion in absolute terms. School closures, deferred fees, and contract non-renewals drove a collapse in private school wages that rivalled the transport sector's decline of 21%. Both dwarfed the hospitality sector in absolute shilling terms.
Administrative and support services fell 24%. Real estate fell 12%. Arts and recreation fell 8%. Mining and manufacturing fell 7% and 6% respectively.
Against that, five sectors grew through the pandemic year:
- Households as employers: +8.1% — domestic workers remained employed as households stayed home
- Financial and insurance: +6.4% — mobile money volumes, digital credit and insurance premiums kept the sector insulated
- Extraterritorial organisations: +5.7% — international organisations and embassies maintained operations
- Construction: +5.5% — Kenya's infrastructure pipeline kept activity running despite the pandemic
- Electricity and gas: +2.0% — essential services with inelastic demand
The construction figure is perhaps the most telling. While most of the private economy contracted, the sector paid out more wages in 2020 than in 2019. The infrastructure investment thesis that Kenya pursued through the preceding decade effectively created a partial shock absorber.
By 2024, accommodation wages had recovered to KES 50.6B — sitting 37% above the 2019 pre-pandemic level. The collapse was real, but the sector rebuilt faster than most projections suggested.
Nine Years of Growth: Where Wages Outpaced the Economy
Looking at the nine-year compound growth rates strips out the noise of individual years and shows which sectors have structurally shifted.
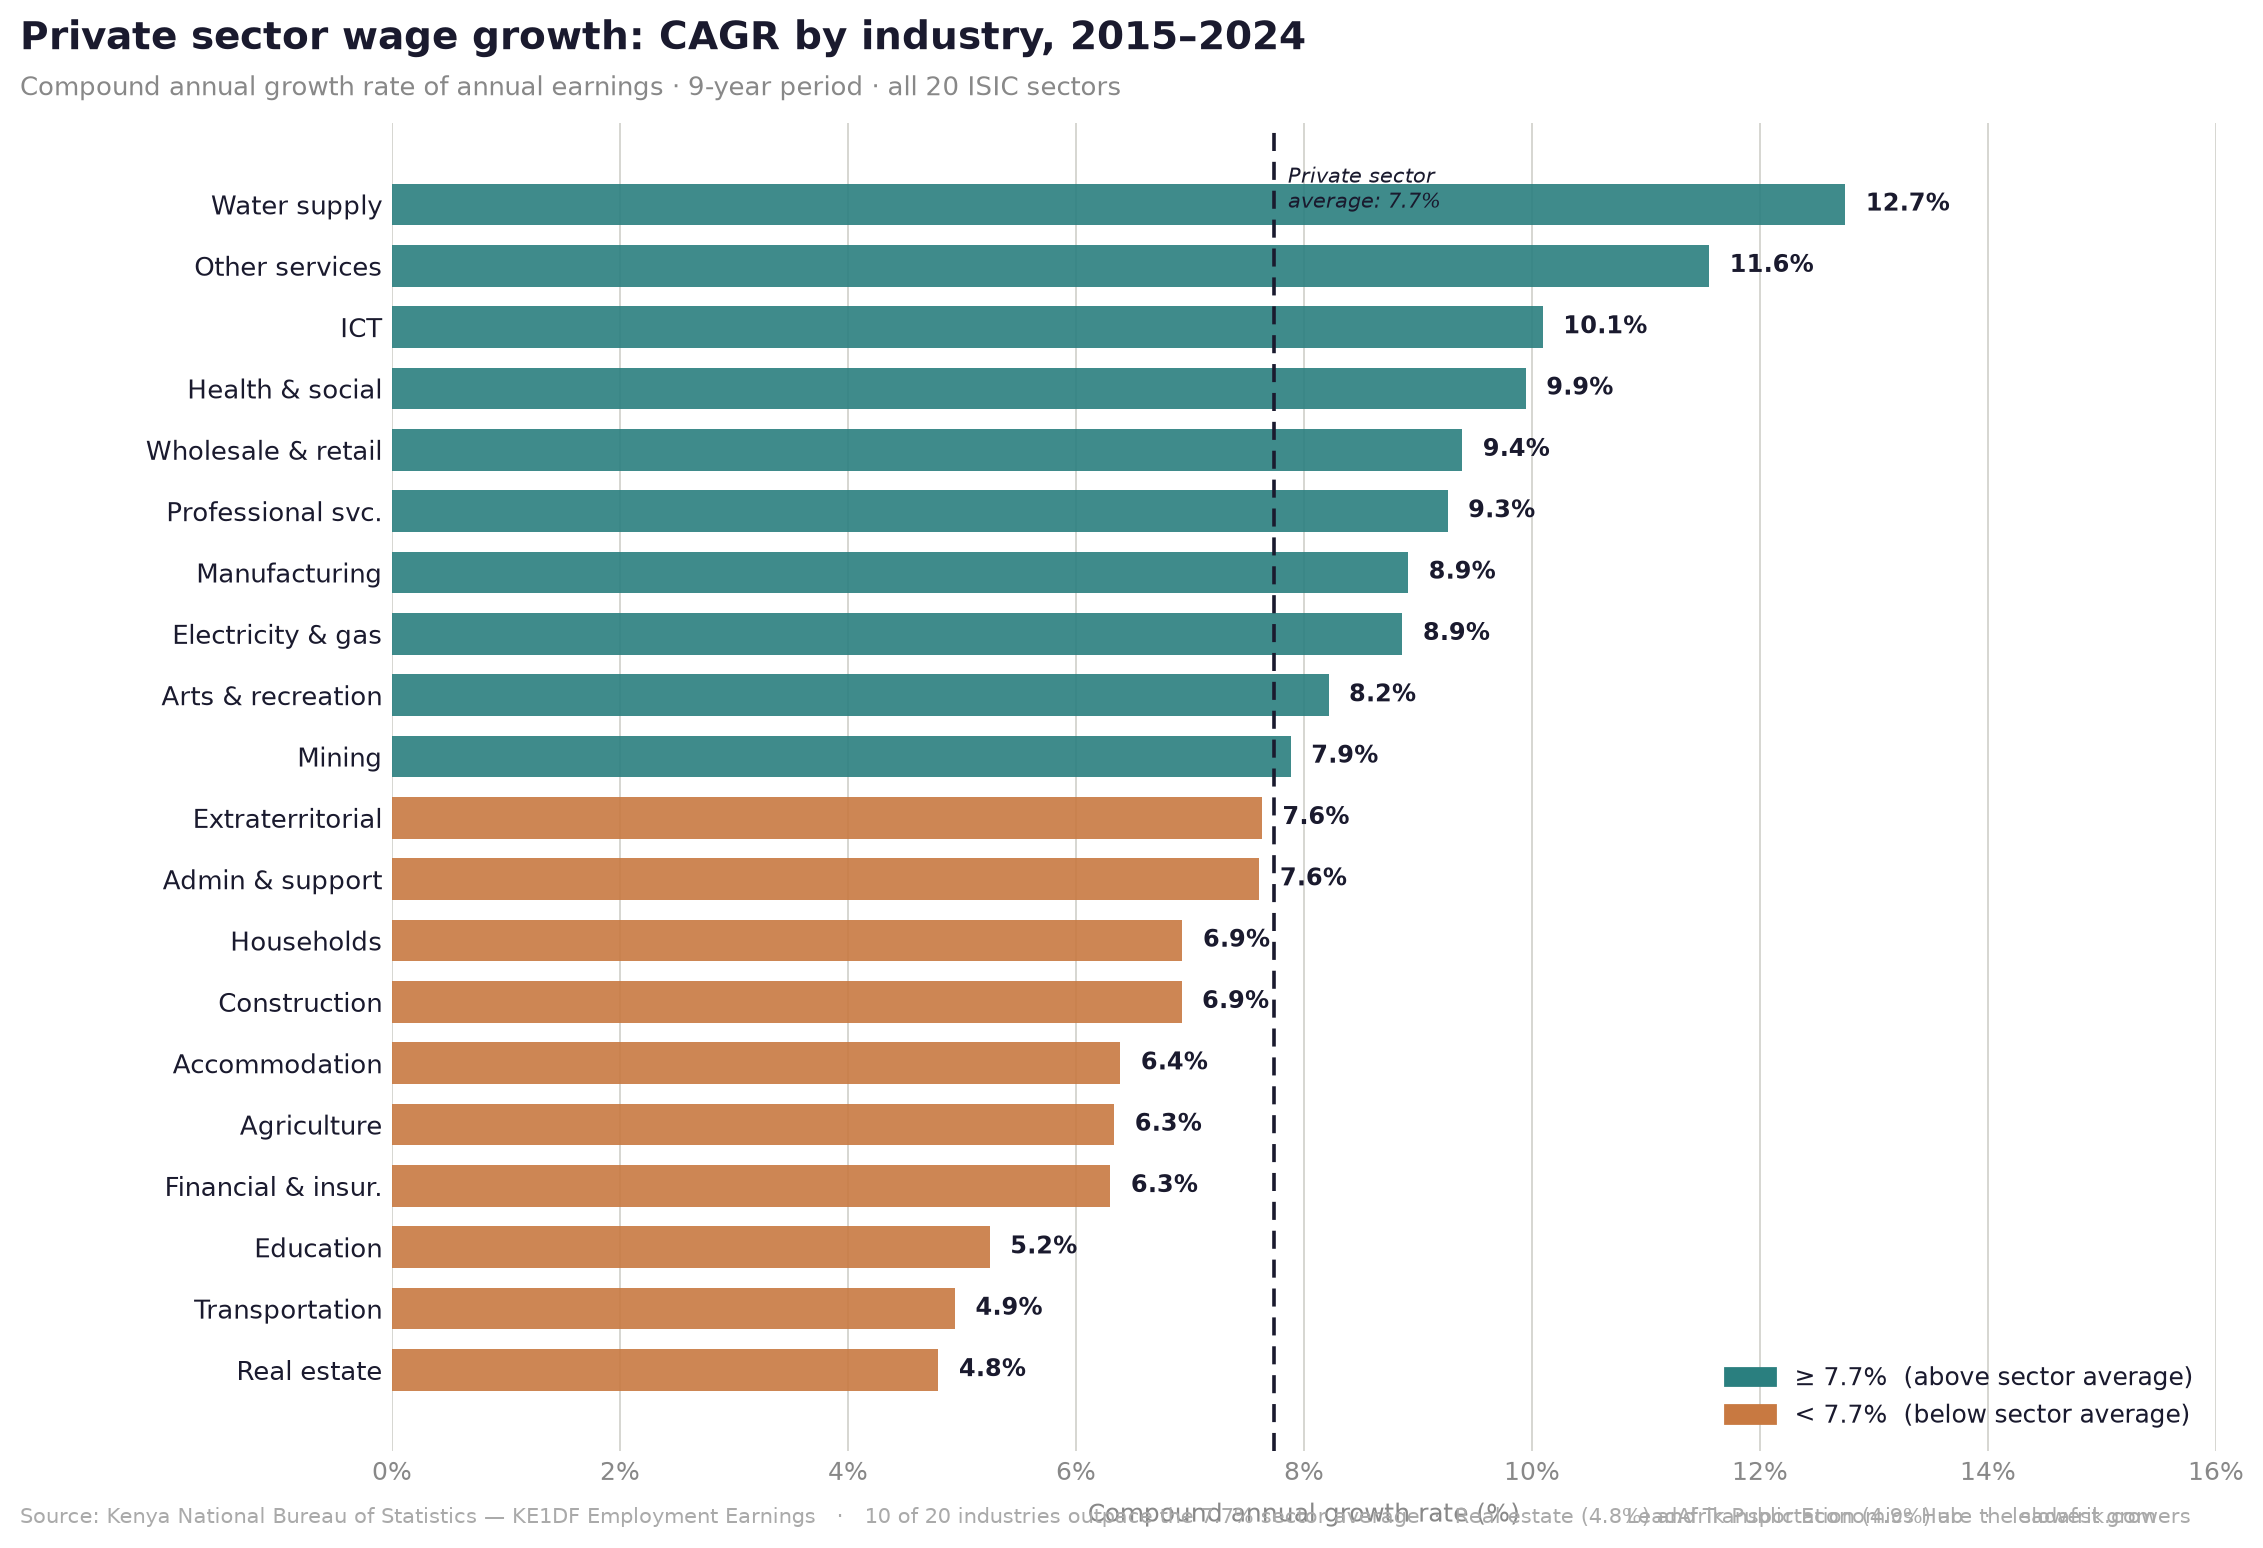
The private sector average was 7.74% CAGR over 2015–2024. Ten industries beat that; ten fell below it.
At the top, Water supply posted a 12.75% CAGR — but from a tiny base of KES 798 million in 2015 to KES 2.35 billion in 2024. The percentage is striking; the absolute size remains small.
Other services (11.6% CAGR), ICT (10.1%), Health and social work (9.9%), and Wholesale and retail (9.4%) are the large-base stories. These are sectors where both the growth rate and the absolute wage pool make the number meaningful. Health nearly tripling from KES 65.3B to KES 153.3B over nine years reflects the expansion of private healthcare in Kenya — hospitals, clinics, pharmacy chains, and diagnostic labs scaling rapidly against rising urban demand.
ICT's 10.1% CAGR compounds to nearly a 2.4× multiple over nine years. That trajectory has not slowed. The 2025 provisional data — where available — shows ICT continuing to grow.
Below the average: Transportation (4.9% CAGR) and Real estate (4.8%) are the slowest-growing wage pools in the private sector. For transportation, this reflects structural constraints — the sector shed wages sharply in 2020 and has not fully regained its pre-pandemic trajectory. For real estate, the wage bill was always small relative to the capital it manages; the low CAGR reflects the sector's structure, not its economic significance.
Two numbers worth flagging: Financial and insurance posted a 6.3% CAGR — below the sector average of 7.74%. And Education posted 5.2% CAGR, also below average, despite being the second-largest private wage pool. Both are large, established sectors growing more slowly than the economy's wage average. In both cases, growth has been more a function of headcount expansion than wage-per-worker increases.
The Public Wage Bill: Where the Money Goes
The public sector paid out KES 881.4 billion in wages in 2024. Understanding where that goes requires one important caveat upfront.
KNBS disaggregates the public sector wage bill across fifteen named industries. Those fifteen industries sum to KES 639.9B — 72.6% of the official total. The remaining KES 241.5 billion is not separately itemised at sector level. It corresponds to ISIC Section O — Public Administration, Defence and Compulsory Social Security: Kenya's civil service, military, police, judiciary, and social security administration. KNBS does not provide a separate row for it in the current dataset, but the arithmetic is unambiguous.
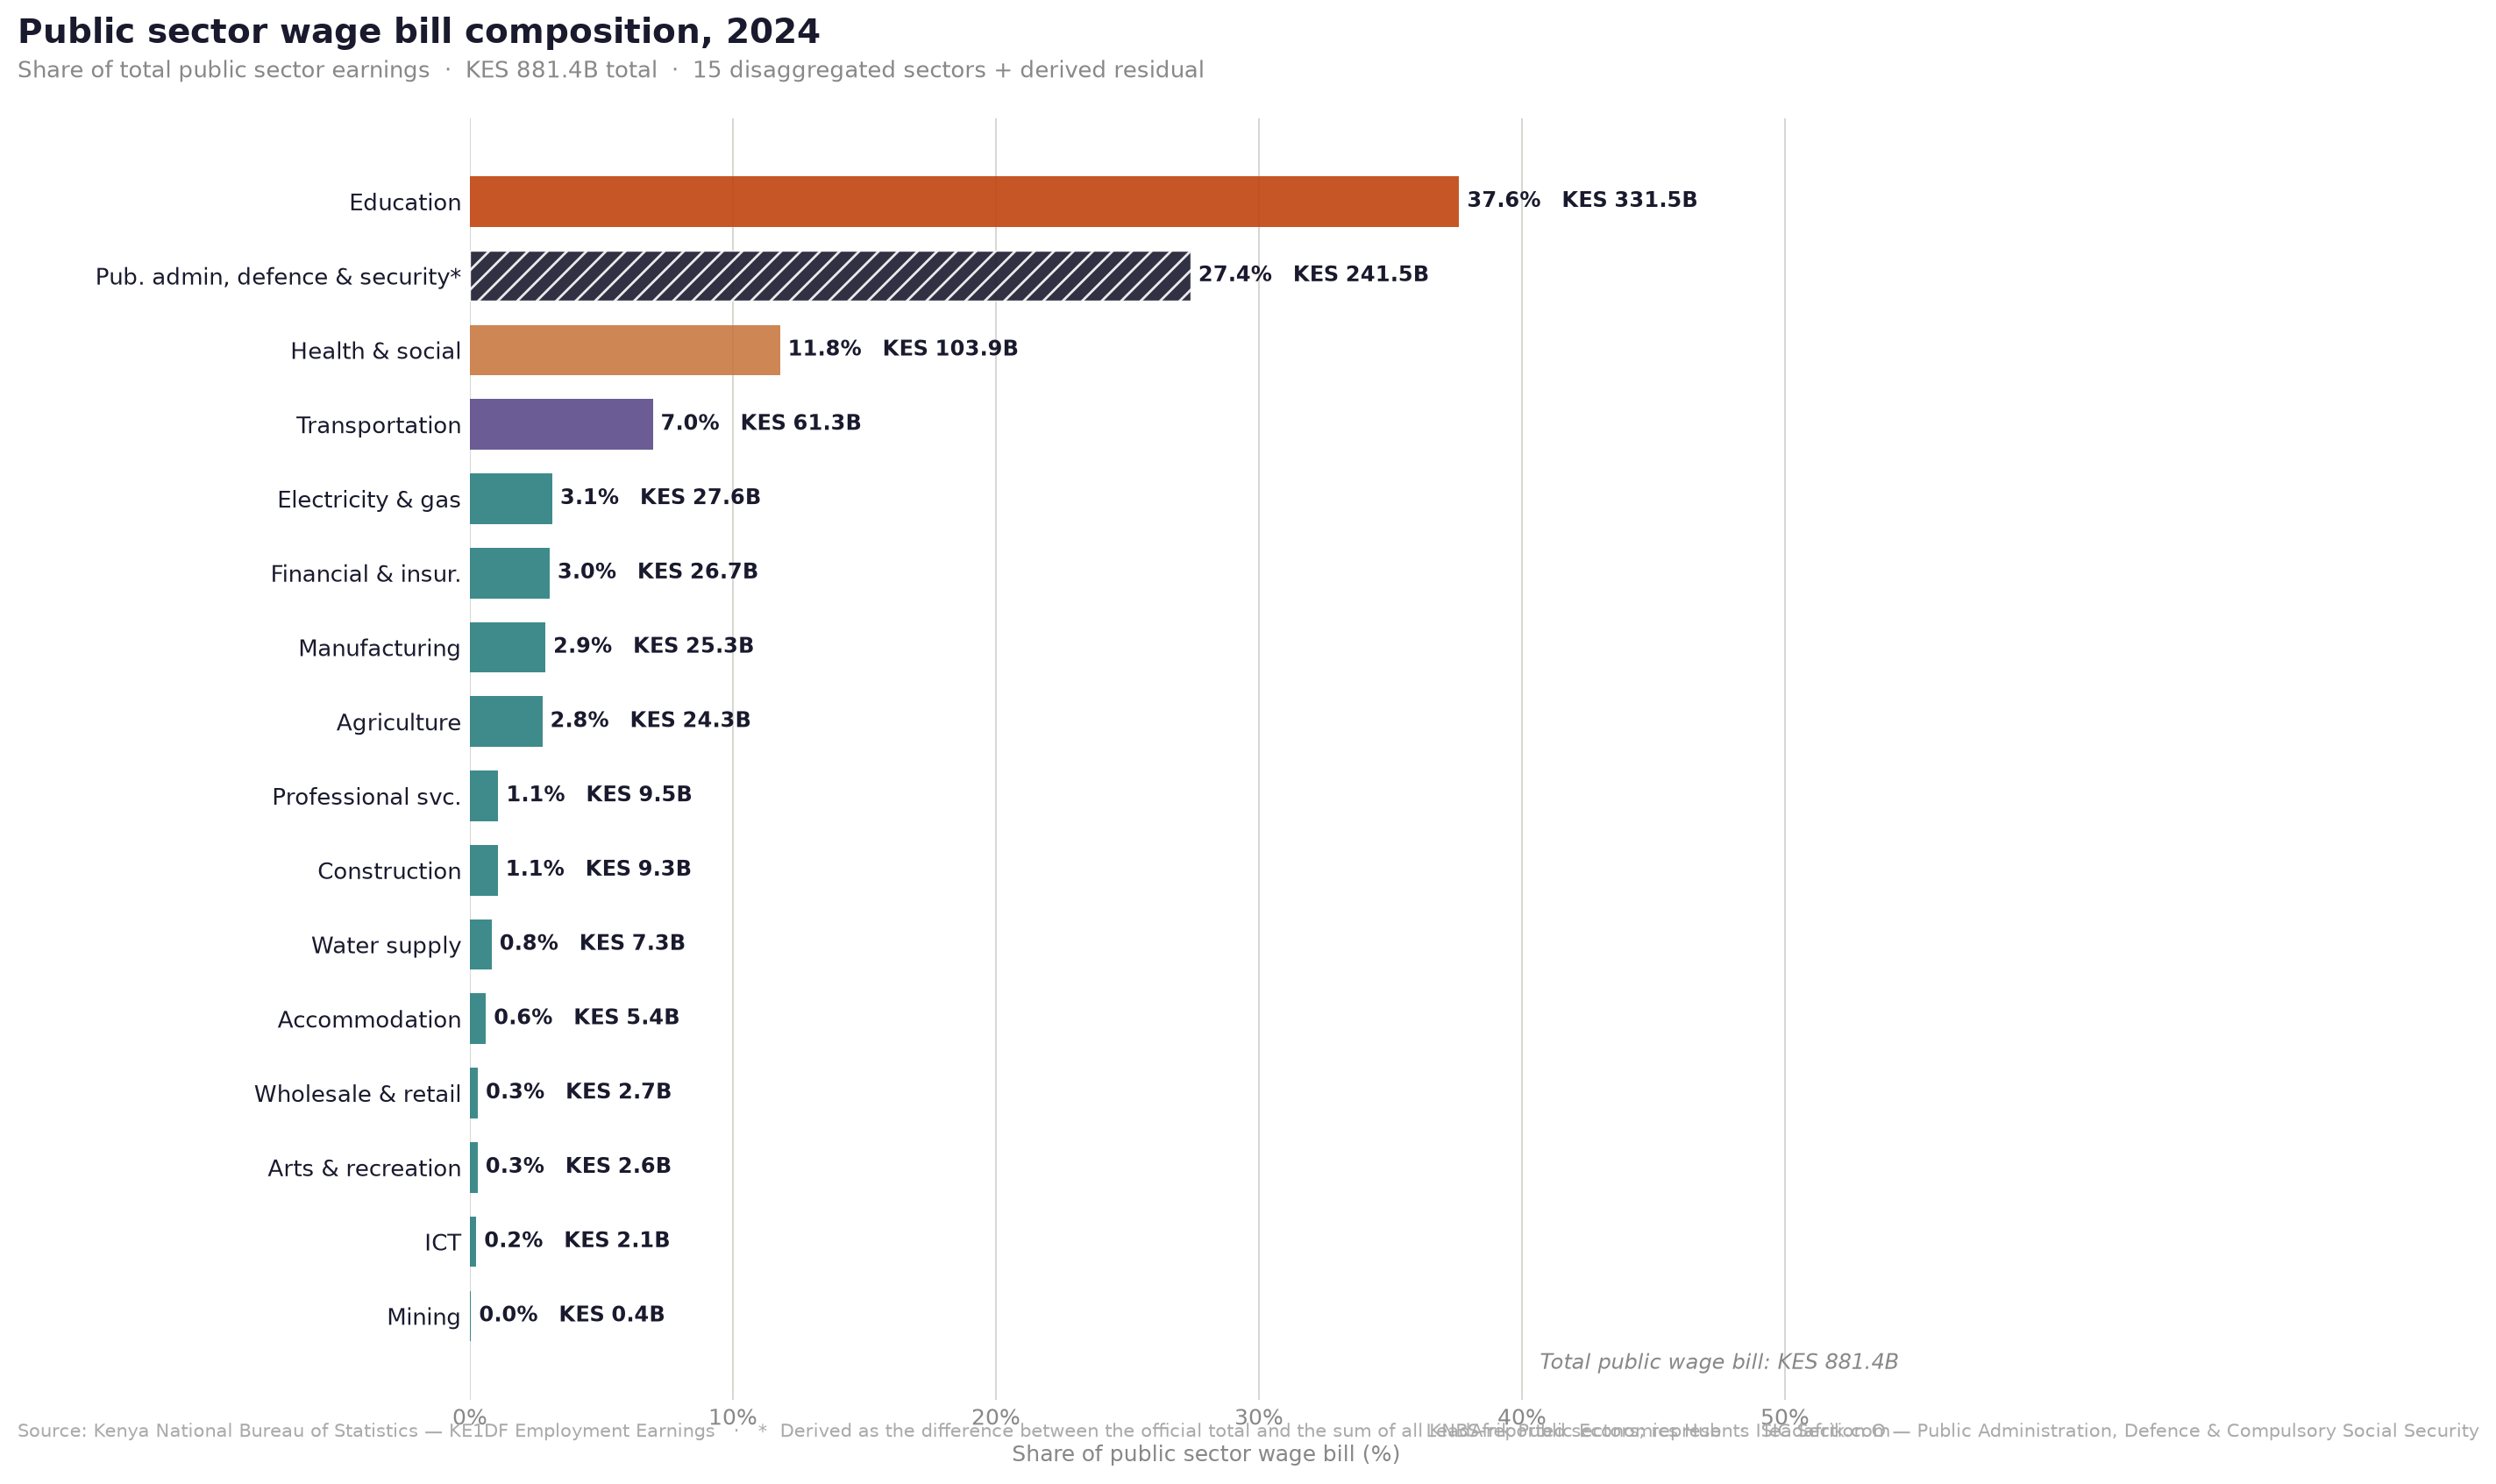
Three categories dominate:
Education: 37.6% — KES 331.5B. More than a third of every public-sector shilling paid in wages goes to teachers and education administrators. Kenya's public school system is one of the largest employers on the continent. The numbers reflect that.
Public administration, defence and security: 27.4% — KES 241.5B. This is the derived residual. It covers everything from the Nairobi headquarters of a ministry to a police post in Turkana County. The fact that KNBS does not publish this as a named row in the disaggregated data is a transparency gap worth noting.
Health and social work: 11.8% — KES 103.9B. Public doctors, nurses, clinical officers, and community health workers. This figure has grown fastest in the public sector — from KES 36.5B in 2015 to KES 103.9B in 2024, a CAGR of roughly 12.3%, reflecting the expansion of the county health system following devolution.
Add Education, Health, and the derived public administration figure together: 76.8% of Kenya's public wage bill sits in three functional categories. Everything else — public manufacturing enterprises, water utilities, transport agencies, financial institutions — collectively accounts for less than a quarter.
What Nine Years of Data Shows
Kenya's formal wage economy grew consistently, with one break point in 2020 and a recovery that was faster in some sectors than others. The private sector is now paying wages at a pace that consistently rewards ICT, health, and services — the sectors aligned with urban consumption, digital infrastructure, and an expanding middle class. Manufacturing has grown solidly. Transport has not.
On the public side, the structural picture has been stable for years: education and security are the dominant consumers of the public wage bill, and Health is the fastest grower. The overall public CAGR of 7.45% means the public wage commitment has grown almost in lockstep with private sector wages — a fiscal commitment that runs regardless of revenue cycles.
The dataset stops at 2024 for most series. The 2025 provisional numbers, where published, show continued growth in manufacturing (KES 320.5B, a sharp acceleration), education, and health. The final 2025 totals for both sectors are not yet published by KNBS.
Data: Kenya National Bureau of Statistics — KE1DF Employment Earnings by Industry and Sector. All figures in KES millions unless otherwise noted. 2025 data provisional. Analysis and charts by LeadAfrik.
Share
Share
If this is useful, send it to someone who'll benefit.